Scaling Network Services and VNF Instances
Reference diagram
The following diagram summarizes the feature:
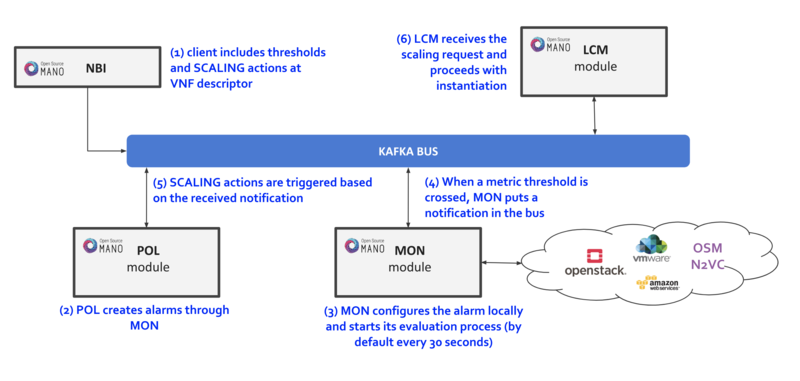
- Scaling descriptors can be included and be tied to automatic reaction to VIM/VNF metric thresholds.
- Supported metrics are both VIM and VNF metrics. More information about metrics collection can be found at the Performance Management documentation
- An internal alarm manager has been added to MON through the 'mon-evaluator' module, so that both VIM and VNF metrics can also trigger threshold-violation alarms and scaling actions. More information about this module can be found at the Fault Management documentation
Scaling Descriptor
The scaling descriptor is part of a VNFD. Like the example below shows, it mainly specifies:
- An existing metric to be monitored, which should be pre-defined in the monitoring-param list (
vnf-monitoring-param-ref). - The VDU to be scaled (
aspect-delta-details:deltas:vdu-delta:id) and the amount of instances to scale per event (number-of-instances) - The thresholds to monitor (
scale-in/out-threshold) - The VDU's (
vdu-profile:id) minimum and maximum amount of scaled instances to produce - The minimum time it should pass between scaling operations (
cooldown-time) - The minimum amount of scaled instances to produce (
max-scale-level)
    scaling-aspect:
    - aspect-delta-details:
        deltas:
        - id: vdu_autoscale-delta
          vdu-delta:
          - id: hackfest_basic_metrics-VM
            number-of-instances: 1
      id: vdu_autoscale
      max-scale-level: 1
      name: vdu_autoscale
      scaling-policy:
      - cooldown-time: 5
        name: cpu_util_above_threshold
        scaling-criteria:
        - name: cpu_util_above_threshold
          scale-in-relational-operation: LT
          scale-in-threshold: 10
          scale-out-relational-operation: GT
          scale-out-threshold: 60
          vnf-monitoring-param-ref: vnf_cpu_util
        scaling-type: automatic
        threshold-time: 1
    vdu-profile:
    - id: hackfest_basic_metrics-VM
      max-number-of-instances: 2
      min-number-of-instances: 1
How to enable/disable autoscaling
With the previous SA architecture based on POL and MON, it is possible to enable/disable autoscaling by patching the POL deployment in kubernetes:
The steps are given below:
- To enable the autoscaling feature, modify the env
OSMPOL_AUTOSCALE_ENABLEDtoTrueinpoldeployment:
- To disable the autoscaling feature, modify the env
OSMPOL_AUTOSCALE_ENABLEDtoFalseinpoldeployment:
With the new architecture, Airflow DAGs for scaling can be selectively disabled in Airflow UI by pressing the toggle next to the DAG to pause/unpause it:
scalein_vdu, to enable/disable auto-scale-inscaleout_vdu, to enable/disable auto-scale-out
Example
This will launch a Network Service formed by an HAProxy load balancer and an (autoscalable) Apache web server. Please check:
- Your VIM has an accesible 'public' network and a management network (in this case called "PUBLIC" and "vnf-mgmt")
- Your VIM has the 'haproxy_ubuntu' and 'apache_ubuntu' images, which can be found here
Get the descriptors:
Onboard them:
cd osm-packages
osm vnfd-create wiki_webserver_autoscale_vnfd
osm nsd-create wiki_webserver_autoscale_nsd
Launch the NS:
osm ns-create --ns_name web01 --nsd_name wiki_webserver_autoscale_ns --vim_account <VIM_ACCOUNT_NAME>|<VIM_ACCOUNT_ID>
osm ns-list
osm ns-show web01
Testing:
- To ensure the NS is working, visit the Load balancer's IP at the public network using a browser, the page should show an OSM logo and active VDUs.
- To check metrics at Prometheus, visit
http://[OSM_IP]:9091and look forosm_cpu_utilizationandosm_average_memory_utilization(initial values could take some some minutes depending on your telemetry system's granularity). - To check metrics at Grafana, just visit
http://[OSM_IP]:3000(admin/admin), you will find a sample dashboard (the two top charts correspond to this example). - To increase CPU in this example to auto-scale the web server, install Apache Bench in a client within reach (could be the OSM host) and run it towards
test.php.
sudo apt install apache2-utils
ab -n 5000000 -c 2 http://<load-balancer-ip>/test.php
# Can also be run in the HAproxy machine.
ab -n 10000000 -c 1000 http://<Private IP of Apache webserver>:8080/
# This will stress CPU to 100% and trigger a scale-out operation in POL.
# In this test, scaling will usually go up to 3 web servers before HAProxy spreads to load to reach a normal CPU level (w/ 60s granularity, 180s cooldown)
If HA proxy is not started
Any of the VMs can be accessed through SSH (credential: ubuntu/osm2021) to further monitor (with htop, for example), and there is an HAProxy UI at port http://[HAProxy_IP]:32700 (credential: osm/osm2018)